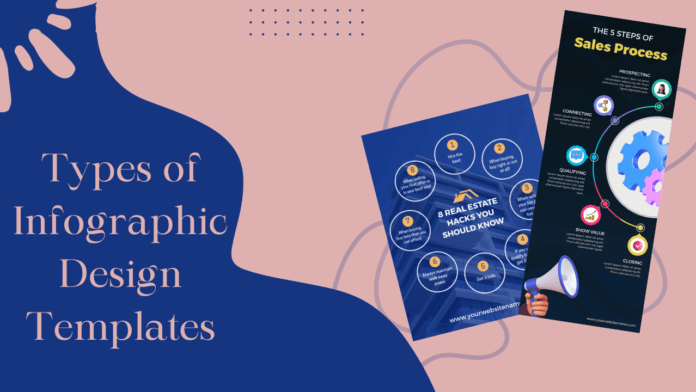
In a world flooded with information, grabbing and retaining the attention of your audience is more challenging than ever. This is where the power of visual communication comes into play, and one effective tool in this realm is the infographic. Infographics combine the best of both worlds – data, and design – to convey complex information in a visually appealing and easily digestible format. In this blog, we will be exploring the types of infographic design templates that can help you to create a creative infographic for your
Importance of Choosing the Right Style
Not all infographics are created equal. The style you choose should align with your message and resonate with your target audience. Choosing the right infographic design is not just about aesthetics; it’s about ensuring that your message is communicated effectively.
Different Types of Infographic Design Templates
Statistical Infographics
1. Bar Charts and Graphs
Statistical infographics are perfect for presenting numerical data. Bar charts and graphs are effective in showcasing comparisons and trends, making complex data more accessible.
2. Pie Charts
When dealing with percentages and proportions, pie charts come in handy. They provide a visual representation of how a whole is divided into its parts.
Informational Infographics
1. How-To Guides
For conveying a process or a set of instructions, how-to guides in infographic form offer a visually intuitive way to communicate complex procedures.
2. Process Flowcharts
Breaking down a complex process into a step-by-step flowchart makes information easy to follow and understand.
Timeline Infographics
1. Historical Timelines
Chronological data shines in historical timelines. Whether it’s the evolution of a product or a company’s journey, timelines tell a compelling story.
2. Project Timelines
Businesses can use project timelines to outline milestones and deadlines, providing a clear overview of the project’s progress.
Geographic Infographics
1. Maps and Location-Based Infographics
When your message involves geographical data, maps and location-based infographics are invaluable. They help visualize data in a spatial context.
2. Comparative Geography Graphics
Comparative graphics, like overlaying maps to show regional differences, provide a nuanced understanding of geographical data.
Tool for Creating Infographics
PhotoADKing
PhotoADKing is a versatile tool designed for creating stunning infographic templates effortlessly. With its user-friendly interface and a plethora of customizable elements, PhotoADKing stands out as the best app to make infographics. The platform provides a wide range of professionally designed templates, making it a go-to choice for individuals and businesses looking to convey information visually.
However, users can easily customize these templates to suit their specific needs, making the creation of engaging and informative infographics a seamless process. From vibrant color schemes to intuitive features, PhotoADKing simplifies the design process for both beginners and experienced graphic designers. Explore the tool to discover a myriad of infographic examples that showcase the tool’s capabilities, empowering users to craft visually appealing content for presentations, social media, and various other platforms.
Tailoring Infographic Design to Your Message
Understanding Your Audience
Before diving into design specifics, it’s crucial to understand your audience. What resonates with them? What visual style aligns with their preferences? Answering these questions ensures your infographic hits the mark.
Aligning Design with Content Tone
The tone of your content should guide your design choices. If you’re presenting serious data, a more formal and structured design might be appropriate. On the other hand, playful and colorful designs can enhance content with a lighter tone.
The Power of Visual Communication
Visual Appeal
Humans are naturally drawn to visuals. The saying “a picture is worth a thousand words” holds true, especially in the digital age. Infographics, with their vibrant colors and engaging layouts, have a unique ability to capture attention.
Information Retention
Studies have shown that people remember information better when it’s presented in a visual format. Infographics tap into this cognitive advantage, making it easier for your audience to retain and recall your message.
Increased Engagement
Whether you’re presenting data-driven insights or guiding your audience through a step-by-step process, infographics increase engagement levels. The combination of images and text creates a dynamic and compelling narrative.
Infographic Design Best Practices
Simplicity is Key
While it’s tempting to pack an infographic with information, simplicity is crucial. A cluttered design can overwhelm the viewer, defeating the purpose of visual communication.
Consistent Branding
Maintaining consistent branding elements across your infographics reinforces your brand identity. From color schemes to typography, coherence is key.
Color Psychology in Infographic Design
Colors evoke emotions and convey meaning. Understanding color psychology can help you choose hues that complement your message and resonate with your audience.
Case Studies
Successful Infographic Campaigns
Examining successful infographic campaigns provides insights into what works. Whether it’s viral content or a high conversion rate, case studies offer valuable lessons.
Learning from Mistakes
Not every infographic campaign is a success. Analyzing failures is equally important, helping you avoid common pitfalls in your own designs.
Infographic SEO Optimization
Image Compression and Alt Text
Optimizing your infographics for search engines involves image compression for faster loading times. Alt text provides textual descriptions for search engine crawlers.
Strategic Keyword Placement
Incorporating relevant keywords into your infographic’s title and captions enhances its discoverability on search engines.
Infographics in Social Media Marketing
Shareability
Infographics are highly shareable on social media platforms. Creating content that users want to share expands your reach and increases brand visibility.
Platform-Specific Design Considerations
Tailoring your infographics to each social media platform’s specifications ensures optimal display and engagement.
The Future of Infographic Design
Interactive Infographics
The future promises even more interactive infographics, allowing users to engage with content actively. This immersive experience enhances user participation.
Augmented Reality Infographics
As technology advances, augmented reality infographics may become mainstream, providing users with a more immersive and dynamic viewing experience.
Conclusion
In the realm of information overload, mastering the art of infographic design is a valuable skill. From choosing the right style to optimizing for SEO and future trends, infographics are a versatile tool in the content creator’s arsenal. Remember, it’s not just about what looks good; it’s about what effectively communicates your message.


